Creating a dashboard
Dashboards in QRY are pages of tiles — charts, KPIs, tables, and text blocks — that you can either build by hand or describe in plain English and let the AI assistant generate. Each tile is bound to its own SQL query against a datasource you have access to.
Goal
You finish this page with a new, named dashboard and at least one chart tile populated with real data.
Prerequisites
- You're logged in.
- At least one datasource grant. Tiles can't render without a datasource.
Steps
1. Open Dashboards
Hover the menu (≡) and click Dashboards. The list view shows recent dashboards as thumbnails on top and a full table below.
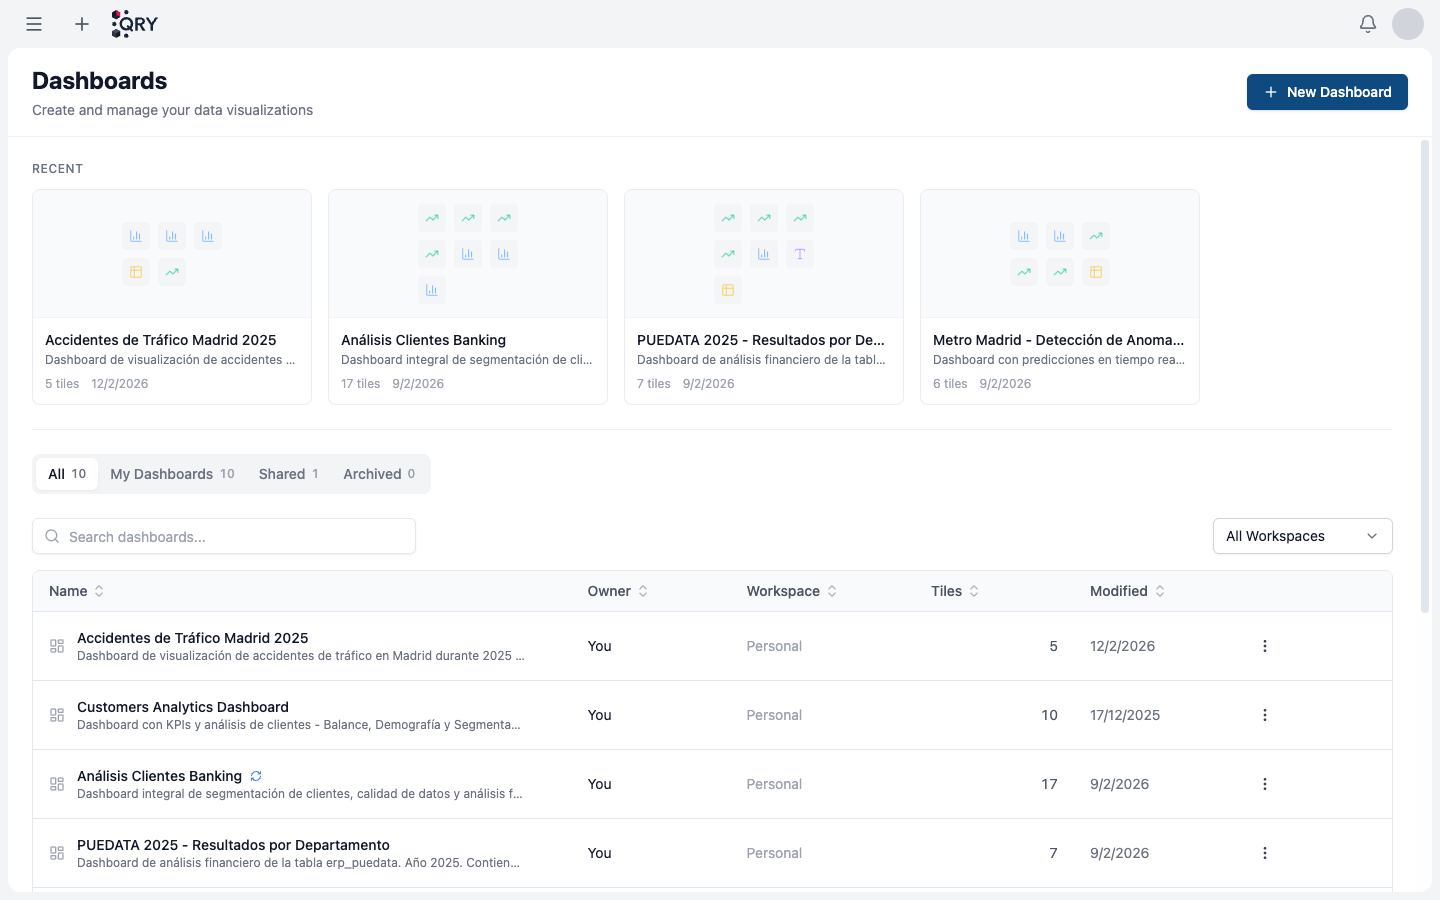
The tabs filter the table:
- All — every dashboard you can see.
- My Dashboards — created by you.
- Shared — created by someone else but shared with you (or with a workspace you belong to).
- Archived — soft-deleted, recoverable for 30 days.
2. Create a new dashboard
Click + New Dashboard in the top-right. QRY asks for a name and an optional description, then opens the empty dashboard in edit mode.
3. Add your first tile
In edit mode, click the + in the tile palette and pick a tile type:
- Chart — ECharts-rendered, supports bar / line / pie / scatter / area and combos.
- KPI — a single number with optional comparison and sparkline.
- Table — paginated tabular results.
- Text — Markdown for headers and notes between tiles.
For chart, KPI, and table tiles you'll be asked for a datasource and a SQL query. QRY can suggest queries from natural language if you'd rather not write SQL.
4. Add global filters (optional)
Open the Filters panel and add filters that affect every tile on the page. Filter types: select, multiSelect, dateRange, date, text. Reference a filter in a tile's SQL with ${filter_id} and QRY substitutes the value at query time.
See Global filters for details on how filter substitution works.
5. Save
Click Save to leave edit mode. The dashboard now appears under My Dashboards for you and (if you put it in a workspace) for every workspace member.
Result
A dashboard page with at least one tile rendering data, accessible from the Dashboards list.
Common issues
A tile shows "Permission denied" but the SQL is correct. Tile queries run with the dashboard owner's permissions for shared dashboards, but each viewer's RBAC / ABAC / DAC is checked independently for the underlying tables. If a viewer lacks access to a table referenced in the tile, the tile fails for that viewer only.
The chart looks empty but the SQL returns rows. Open the tile's Edit panel and check the X / Y axis mappings. Charts need at least one categorical column (X) and one numeric column (Y).
Global filter ${filter_id} isn't substituted.
The filter id has to match exactly (case-sensitive). Open the Filters panel and copy the id from there.
See also
- Tile types — chart, KPI, table, text.
- Global filters — cross-tile filtering with
${filter_id}. - Dashboards reference — full feature reference, including the AI-assisted creation flow.
- Sharing a conversation — public links work for dashboards too.