Creating a notebook
A QRY notebook is a Jupyter-like sequence of cells you can mix freely — SQL, Python, and Markdown — to build a repeatable analysis. Each cell can use its own model, and notebooks live in folders that map to your Personal space and any Workspaces you belong to.
Goal
You finish this page with a new notebook open in the IDE and one cell ready to run.
Prerequisites
- You're logged in. See Your first login if not.
- At least one datasource you can query (notebooks bind to a datasource the same way conversations do).
Steps
1. Open the Notebooks IDE
Hover the menu (≡) and click Notebooks. The IDE opens with the Explorer on the left and an empty workspace on the right.
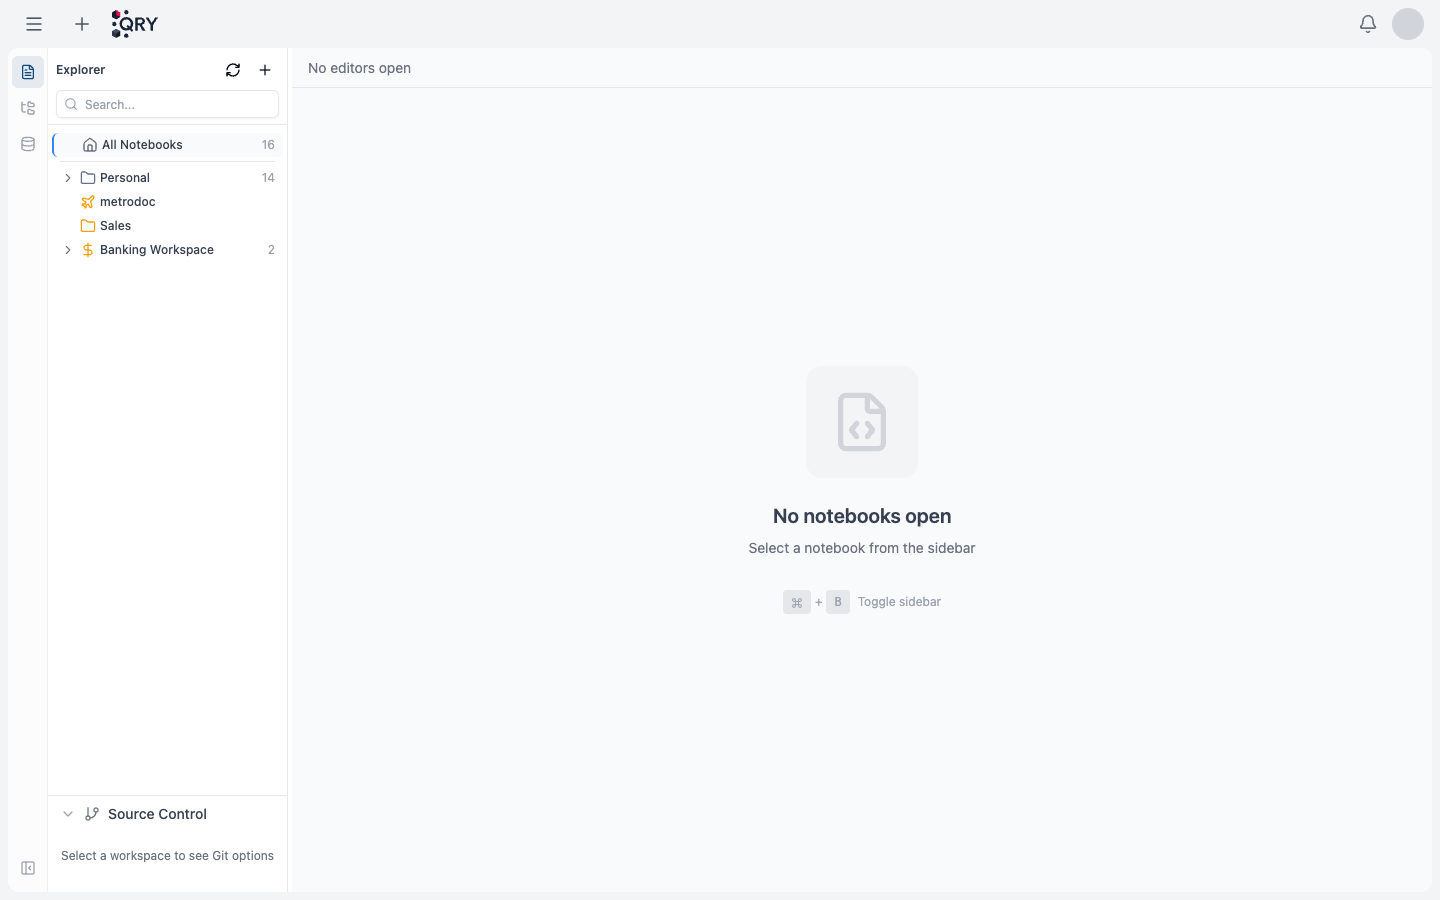
The Explorer organises your notebooks by folder:
- Personal — notebooks only you can see.
- Workspace folders (e.g. Sales, Banking Workspace) — notebooks shared with the workspace's members.
The activity bar on the far left lets you switch between Explorer, the schema tree, and the datasource browser without leaving the IDE.
2. Create the notebook
Click the + icon in the Explorer header and pick a folder. QRY creates an empty notebook and opens it in a new editor tab.
You can rename it inline by clicking the title in the tab.
3. Add your first cell
A new notebook starts with one cell. Use the toolbar to choose its type:
- SQL — runs against the notebook's bound datasource.
- Python — runs in the Python execution environment (Gemini native or Kubernetes, depending on what your code imports).
- Markdown — for documentation between code cells.
Each cell can use its own model — useful when you want a cheap model for routine SQL and a strong model for a Python analysis at the end.
4. Bind a datasource
If you want SQL cells to run, set the notebook's datasource at the notebook level (toolbar at the top of the editor). Datasource, catalog, and schema are shared across all cells in the notebook.
5. Run the cell
Press Shift+Enter in the cell to run it. SQL results render as a table; Python output renders inline (charts auto-captured — see Creating charts for plot-specific tips).
Result
You have a notebook with one cell that runs and shows output.
Common issues
The Explorer is empty. Either you haven't created any notebooks yet (expected on a new account) or the workspace you're in has none. Either case, the + in the Explorer header creates one.
SQL cell errors with "no datasource selected". Set the datasource at the notebook level, not the cell level. The toolbar above the editor area has the picker.
Python cell hangs or errors with import not found.
Heavy libraries (plotly, xgboost, lightgbm, statsmodels, reportlab, openpyxl, fpdf, python-pptx, python-docx) trigger the Kubernetes executor automatically. Cold start of the K8s executor takes ~10–20 seconds the first time.
See also
- Cell types and models — what each cell type does and when to use which model.
- Scheduling a notebook — run a notebook on a schedule.
- Git Folders — push and pull notebooks to GitHub / GitLab / Bitbucket.
- Notebooks reference — full feature reference.